
The video games industry has seen more and more growth with each year and it’s only forecasted to go up even higher. According to many reputable reports and deep analysis conducted by analysts on Statista, this industry may go up to around ~$280 billion by 2025 from a previous $189.3 billion in 2021.
Major Industry Stats You Want To Be Wary Of
I have collected various amounts of data to give a macro view of what the industry generally looks like. Sources for all the data used are Statista and Kaggle. I have also scrapped many popular sites for game sales data for calculated forecasting as well.
The Gaming Market
In this section, you will find different statistics of all the different gaming market values concerning the globe and certain regions. Due to the impurity of a lot of data, some of these statistics could be a bit biased.
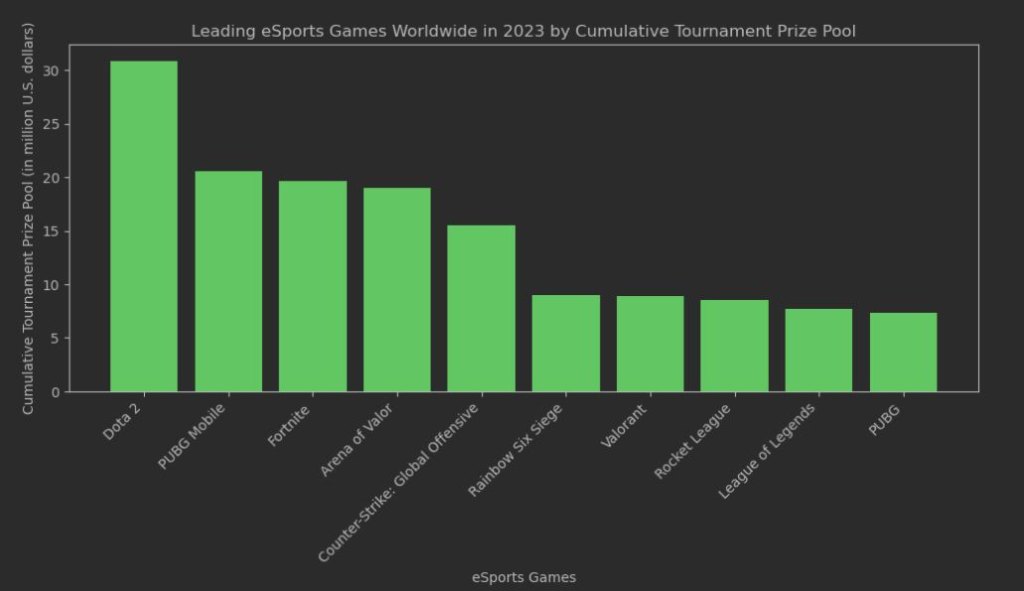
Cumulative Tournament Prize Pools
The chart displays the cumulative tournament prize pools for various eSports games in 2023. The data is measured in millions of U.S. dollars.
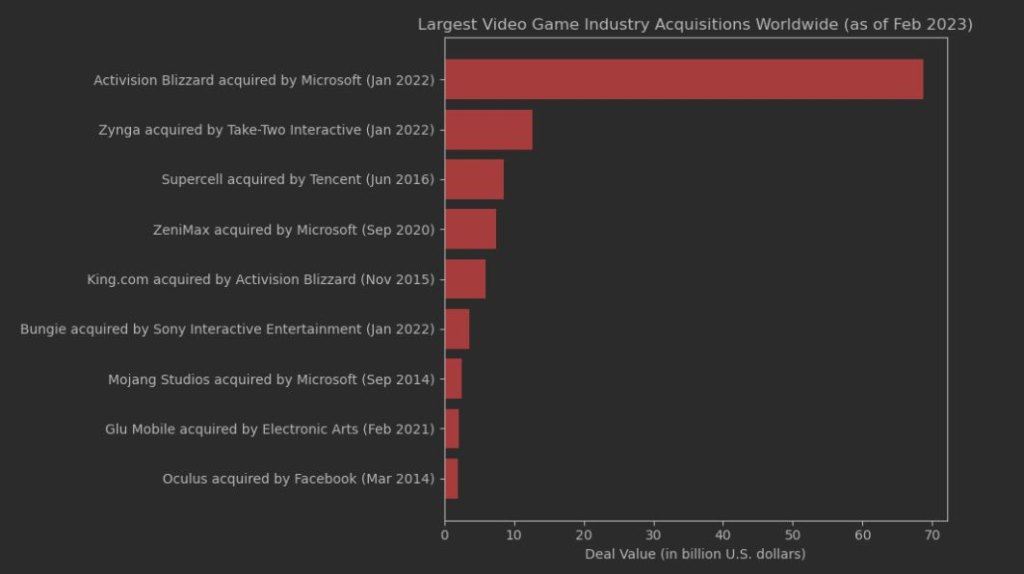
Largest Video Game Industry
The chart highlights the dominance of Microsoft in the top acquisitions, as well as the substantial investments made by other major companies like Take-Two Interactive, Tencent, Activision Blizzard, Sony, Electronic Arts, and Facebook.
Epic Game Gross Value
This chart highlights a strong recovery and growth trajectory for Epic Games’ revenue following the dip in 2019, with steady increases expected through 2026.

Major Upcoming Games
The following charts highlight the major upcoming games across various platforms, including PlayStation, Xbox, and PC, showcasing the exciting releases that gamers can look forward to.
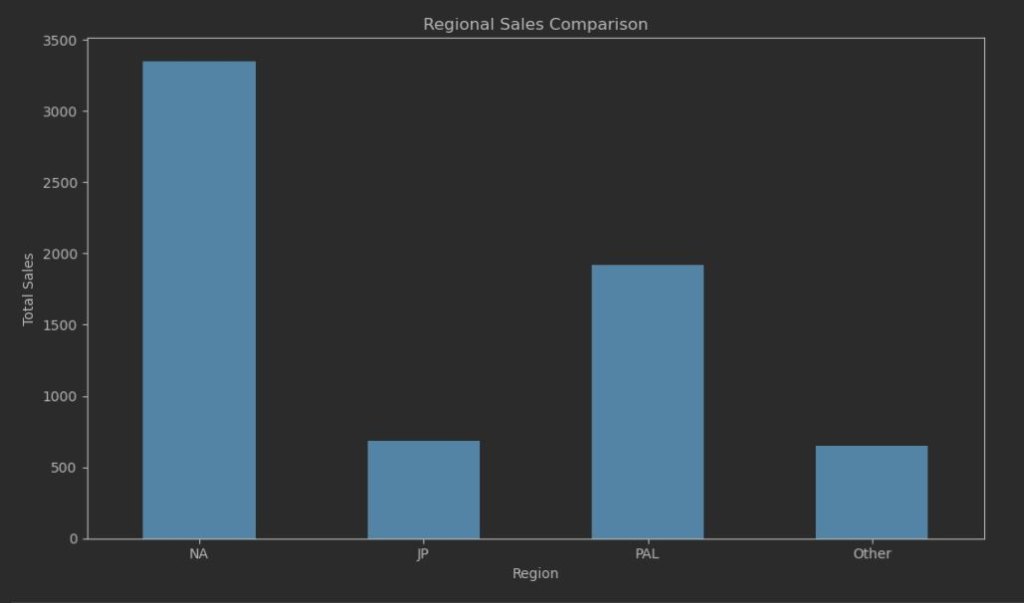
This one in particular explains the total regional sales comparison.
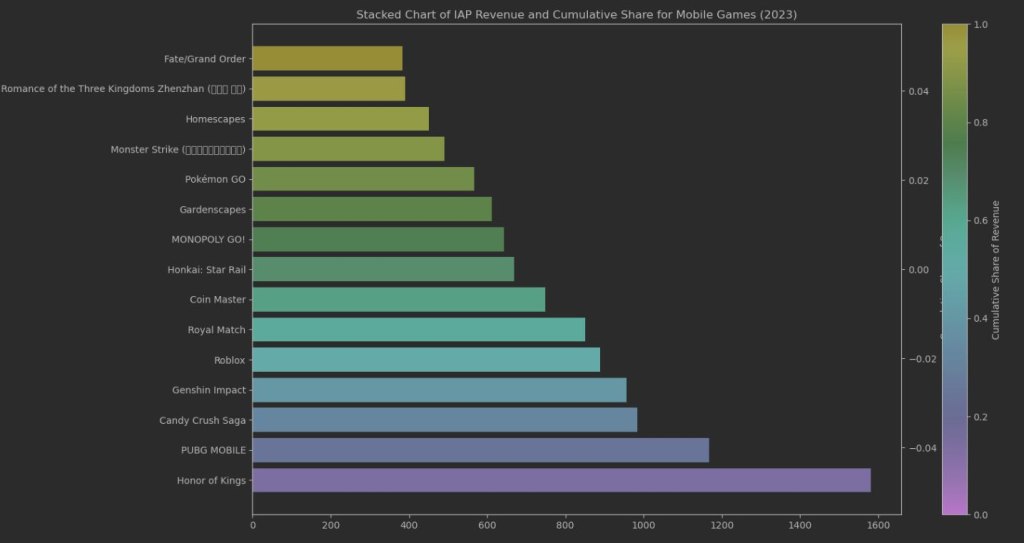
Stacked Chart
The stacked bar chart visualizes the in-app purchase (IAP) revenue for various popular mobile games in 2023. The chart also includes a color-coded cumulative share of revenue to illustrate each game’s contribution to the total IAP revenue.
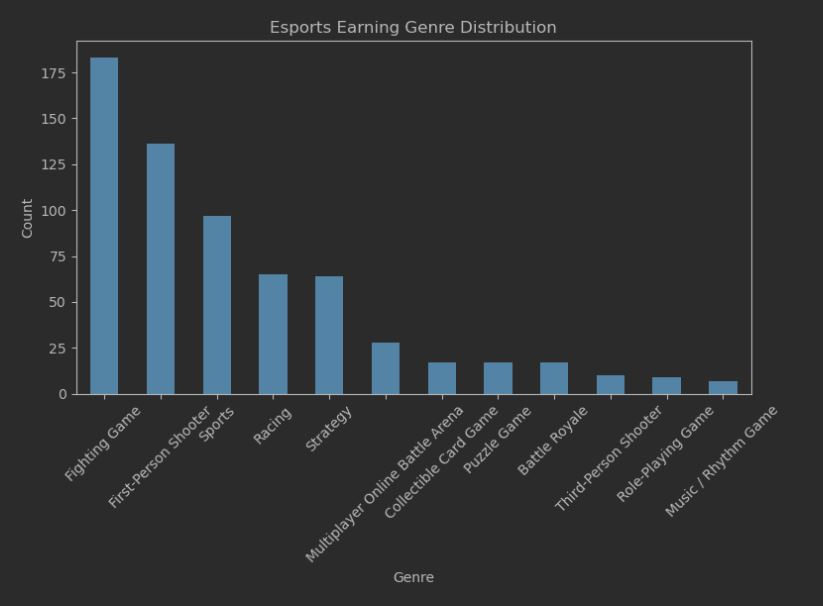
Earning Genre Distribution
This chart illustrates the distribution of earnings across different esports game genres. The chart showcases the count of earnings occurrences for various genres, indicating their popularity and financial success within the esports industry.
Gamers And Gaming
Explore the age distribution of gamers in the US with these charts, revealing the significant presence of gaming across various age brackets.
Gamers By Region
Asia has more than twice as many gamers as any other region, with 1.48 billion active gamers. In fact, the number of active gamers in Asia exceeds the combined total of active gamers in Europe, Latin America, and North America, which is 1.42 billion. (According to data till Sep 2021). However, the number of players in different regions are explained in graph:
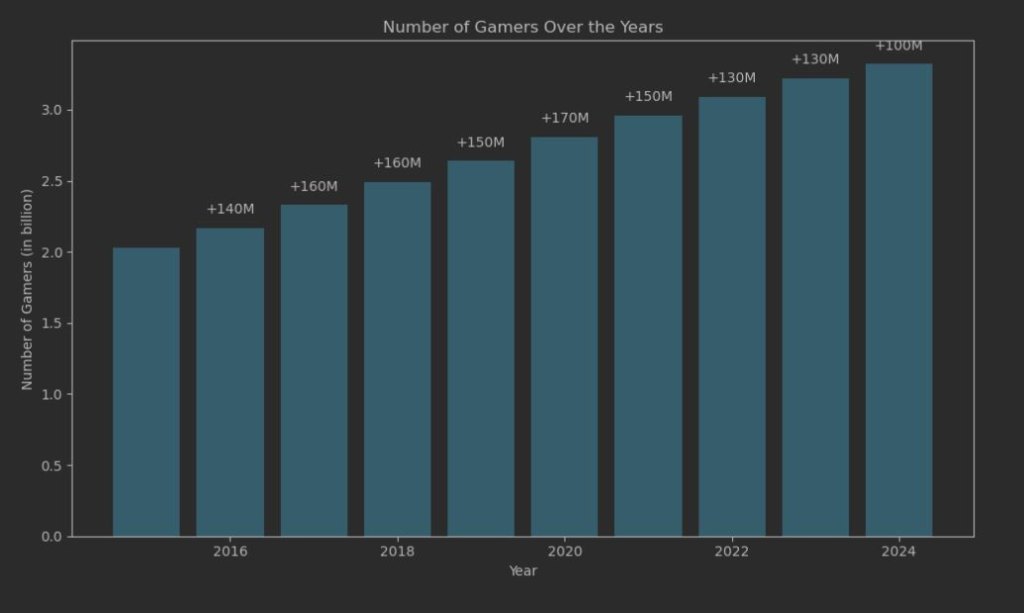
Number Of Gamers
The chart highlights the annual increase in the number of gamers, with increments ranging from +130 million to +170 million each year. This data demonstrates the steady and robust growth of the gaming industry in terms of its global audience.
Major Gaming Studios Statistics
These charts present an analysis of the forecasted market value of Epic Games Studio, highlighting expected growth trajectories and market performance.
2019: There is a significant drop to about 4,200.
2020: The market value rises to approximately 5,100.
2021 to 2024: The market value remains relatively stable, with slight increases, hovering around 5,000 to 5,500.
2024+: The market value peaks at around 6,000.
2026+: The Market value is supposed to touch 6000+
Thanks! Do share your feedback with us. ⚡
How can we make this post better? Your help would be appreciated. ✍